Customer Experience metrics are vital to business success. After all, “You can’t improve what you don’t measure”. Wise words indeed. CX leaders and marketers must use customer experience data to show CX’s Return On Investment (ROI) to demonstrate a link between improved customer satisfaction and wider business outcomes. In particular, customer retention, purchase frequency, lifetime value, and the impact of reviews, testimonials, and referrals on conversions.
Customer experience metrics offer valuable insights into customer satisfaction and loyalty. By understanding and analysing these results, businesses can refine their strategy and improve the end-to-end customer journey. Here, we explore essential CX metrics—such as Net Promoter Score (NPS), Customer Satisfaction (CSAT), Customer Effort Score (CES), and Customer Churn Rate (CCR)—including how to measure them effectively and use the findings to drive long-term success.
Table of contents:
- What Are Customer Experience Metrics?
- Why Should Firms Track Experience Metrics?
- Four Core Customer Experience Metrics
- How to Measure Customer Experience Metrics
- Six Ways To Implement Customer Experience Metrics
- How to Improve Customer Experience Metrics
What Are Customer Experience Metrics?
Customer Experience metrics are Key Performance Indicators (KPIs) that show the quality of interactions between a business and its customers. These metrics evaluate satisfaction, loyalty, and overall engagement, providing insight into customer service effectiveness and product offerings.
Some metrics measure customer loyalty by asking if they would recommend the company to others. Customer satisfaction is quantified at specific touchpoints in the customer journey, and the ease of customer interactions highlights potential friction. Metrics can also measure customer churn rate to assess why customers end their business engagement.
The best-known and most commonly used CX metrics are:
- Net Promoter Score (NPS) to measure customer loyalty
- Customer Satisfaction Score (CSAT) to define how happy customers are
- Customer Effort Score (CES) to measure the ease of customer interactions
- Customer Churn Rate (CCR) to track customer retention
Why Should Firms Track Experience Metrics?
With solid data, companies can identify and resolve pain points to increase customer satisfaction, which leads to repeat business, positive reviews and referrals and increased revenue. Acting on valuable Customer Experience metrics allows a company to build a loyal customer base and can give them a competitive edge.
Evaluating these metrics allows businesses to understand customer perceptions, resolve issues, and make improvements. Over time, accurate metrics enable companies to track progress and trends, whether positive or negative, and make decisions based on genuine data rather than hearsay. Regular analysis of CX metrics creates a customer-focused culture, driving continuous improvement for long-term success.
CX metrics provide businesses with crucial insights into customer experiences and their perception of the brand. Companies can pinpoint improvement areas by measuring loyalty, satisfaction, effort, and churn. For example, if the metrics reveal customers are dissatisfied with customer service, further training can be activated to enhance staff performance. A data-led approach gives businesses the confidence to develop strategies that improve customer satisfaction and loyalty.
Four Core Customer Experience Metrics
Net Promoter Score (NPS)
Net Promoter Score, often shortened to NPS, measures customer loyalty, satisfaction and enthusiasm for a company. We ask: “On a scale of 0 to 10, how likely are you to recommend this product or company to a friend or colleague?”
NPS scores are categorised into Promoters (9-10), Passives (7-8), and Detractors (0-6). To calculate the final score, subtract the percentage of Detractors (0-6) from the rate of Promoters (9-10). Passives (7-8) are excluded from the calculation. The resulting score ranges from -100 to +100, indicating overall customer loyalty and the likelihood of recommendation.
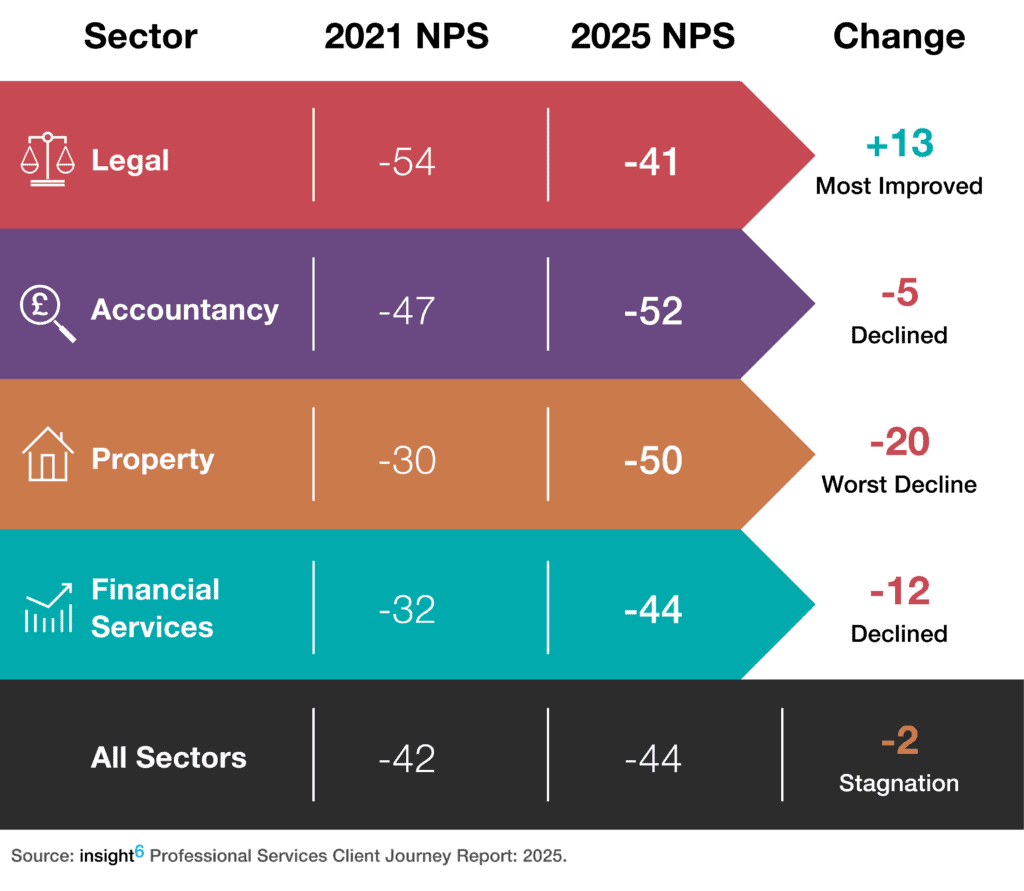
Our most extensive market study into how professional service firms handle new business revealed that legal firms scored the best NPS at the enquiry stage. With mergers and private equity investment, customer experience standards are more important than ever. To learn the truth about enquiry handling in Professional Services, download our Report now!

Customer loyalty is essential in the legal profession. Since working with insight6, the Leading Southwest law firm, Stephens Scown has achieved an NPS 12% higher than the industry average. Read our case study to find out how.
Customer Satisfaction Score (CSAT)
Customer Satisfaction Score or CSAT, measures immediate customer satisfaction by asking customers to rate their experience on a scale of 1 to 5. It’s crucial for gauging real-time customer happiness, identifying service issues, and implementing quick improvements. The average CSAT score indicates immediate customer satisfaction.
CSAT survey questions might include:
- How satisfied were you with your recent experience? (1-5 scale)
- How would you rate the quality of service you received? (1-5 scale)
- How likely are you to use our service again? (1-5 scale)
- How well did we meet your expectations? (1-5 scale)
Businesses across all sectors use the CSAT Customer Experience metric to improve their CX. From retail shops, hospitality venues and medical clinics to telecoms, professional services and technology, online and in-person experiences are measured with CSAT to identify areas of poor customer satisfaction so that improvements can be made.
Customer Effort Score (CES)
The Customer Experience metric, Customer Effort Score (CES), quantifies the ease of customer interactions by assessing how much effort was required to resolve an issue. Typically measured on a scale from ‘very easy’ to ‘very difficult’, CES highlights friction points and guides businesses to streamline processes and improve overall customer experience.
CES is gathered using email, pop-ups, and post-interaction surveys. Customers are asked to rate how well any issues that arose are rectified. Reducing customer effort is critical for improving retention rates.
Let’s take a telecoms company as an example. Customers expect an excellent experience and want service issues to be resolved efficiently. A CES survey identifies challenges like long wait times or complex billing issues. Companies can address the pain points by installing call routing systems, customer callback, and simplifying billing dispute processes. These changes will lead to improved CES scores as customers find resolving their issues easier and less frustrating.
Customer Churn Rate (CCR)
Customer Churn Rate (CCR) measures the percentage of customers who stop doing business with a company over a specific period. Tracking this Customer Experience metric helps firms identify retention issues, understand customer behaviour, and implement strategies to improve loyalty.
The formula for calculating CCR is: (number of customers lost during a period ÷ number of customers at the start of the period) × 100. The result reveals the percentage of customers who have stopped interacting with a business.
A retail company can reduce churn by implementing a loyalty programme, offering personalised discounts and improving customer service. These strategies enhance customer experience and satisfaction, significantly reducing churn rate and fostering long-term customer loyalty.
The insight6 CX Business Pack offers more insights, tools, and the latest trends on building exceptional Customer Experience strategies. Download the CX Business Pack 2025—insight6 for free.

How to Measure Customer Experience Metrics
Capturing meaningful Customer Experience metrics relies on a mix of survey methods, feedback tools, and analytics dashboards:
Survey Methods – Surveys remain among the most effective ways to gather CX data. Tools like Net Promoter Score (NPS), Customer Satisfaction (CSAT), and Customer Effort Score (CES) help businesses measure customer loyalty, satisfaction, and ease of service.
Feedback Tools – Feedback platforms provide real-time insights into customer sentiment. Businesses can gather reviews via Google, monitor social media comments, and integrate in-app surveys to capture immediate experiences.
Analytics Dashboards – Dashboards visually present Customer Experience data, helping teams spot trends and problem areas quickly. Customer journey analytics track every step a customer takes, sentiment analysis measures how customers feel, and heat maps show where users interact most on websites and apps.
Together, these methods offer a complete picture of the customer experience, empowering businesses to make data-driven improvements.
Six Ways To Implement Customer Experience Metrics
Step One: Define Clear Objectives
Establish specific goals for your Customer Experience metrics. Is it improving customer satisfaction, reducing churn, or enhancing customer loyalty?
Step Two: Identify Key Metrics
Determine which metrics are most relevant to your objectives. Standard CX metrics to use are NPS, CSAT, CES and CCR.
Step Three: Select the Right Tools
Choose measurement tools that align with your identified metrics. For example, use survey tools for NPS and CSAT and customer journey analytics tools for tracking CES and CCR. Incorporate feedback collection points, like post-purchase surveys, in-app feedback, and follow-up emails, at key customer journey stages.
Step Four: Use Analytics Dashboards
Analytics dashboards help visualise and track CX metrics data in real time, identifying trends, monitoring performance, and making data-driven decisions to improve customer experience.
Step Five: Develop Employee Training
Ensure your team understands why CX metrics are vital and how to operate them. Provide Customer Experience training on interpreting data and making the necessary improvements based on solid insights.
Step Six: Monitor Metrics
Review your CX metrics regularly and gather feedback on the measurement process itself. Adjust your strategy and tools to stay aligned with objectives.
How to Improve Customer Experience Metrics
Gathering Customer Experience data is a smart first step, but real value comes from turning insights into action. Many businesses invest in surveys and feedback tools with the best intentions, but struggle to maintain momentum once the day job takes over. Without accountability, CX improvements often stall.
To truly improve CX metrics, businesses must go beyond collecting data. Analysing feedback to spot recurring themes and pain points is crucial. From there, issues can be prioritised based on their impact on customer satisfaction and business performance. Develop targeted action plans involving teams across the organisation, ensuring everyone shares the drive to deliver a consistent, exceptional experience.
Successful firms create a culture where CX isn’t left to chance. They measure progress against clear goals and adjust strategies based on real-time insights to keep improving.
At insight6, we know the difference an independent perspective can make. As an external partner, we help firms stay focused, identify blind spots, and hold teams accountable for delivering meaningful change. Whether working alongside your internal team or acting as a fractional Chief Customer Experience Officer, we bring structure, expertise, and measurable results.
Want proof it works? See how we helped Bishop Fleming, one of the UK’s leading accountancy firms, to benchmark and enhance their client experience. Read the case study here.
Ready to unlock the full potential of your CX metrics? Book a free, no-obligation consultation with one of our Customer Experience Directors today or subscribe to our newsletter for more expert insights.
Like what you’ve read? Sign up for the insight6 newsletter to stay ahead of the competition with the latest insights and strategies to enhance your customer experience.


0 Comments